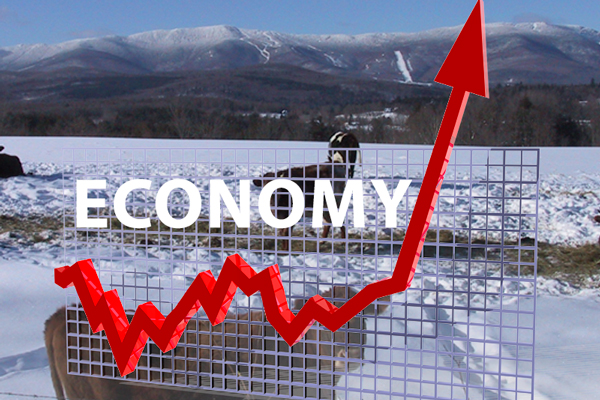
“We have a fairly diverse economy and, generally, it’s growing,” said executive director of the Mad River Valley Planning District (MRVPD) Joshua Schwartz.
The planning district, created by the towns of Fayston, Waitsfield and Warren in 1985, has collected data on themes such as population, housing and transportation for their Mad River Valley 2015 Annual Data Report, which was finished in April.
The report was authored by Schwartz and planning coordinator Dara Torre. It was created to address the requirement of the district’s 1998 memorandum of understanding (MOU) between the three Valley towns and Sugarbush Resort.
Most data is based on the 2014 calendar year and is gathered from a variety of public sources and several consultants who were involved in the district’s 2014 economic study.
DATA DETAILS
The data covers employment in The Valley, rather than employment of Valley residents who work in other regions. It looks at the activity of businesses that purchase employment insurance and not those who are self-employed.
In 2014, the Vermont Department of Labor began including data on Northfield with that of Fayston, Moretown, Waitsfield and Warren. The MRVPD did not want to include Northfield in their report and requested information for Valley towns alone, but the department of labor then withheld information regarding industries that contained only one to three establishments. These include information, financial services, private education and health care and social services.
Data is withheld for industries that show numbers below a certain threshold, Schwartz said.
BUSINESS NUMBERS
In The Valley, employment peaked in 2005, with stable numbers since 2010, the report shows. Compared to state and county employment trends, however, The Valley experienced steeper prerecession declines.
The sector with the largest increase of businesses between 1988 and 2014 is the professional and business category, having grown from 44 to 90 businesses over the years. The number of businesses in construction and financial services has also grown, while retail businesses have decreased since 1988.
JOB NUMBERS
The leisure and hospitality industry offers the most jobs, at 1,016 in 2014. These jobs include part-time and seasonal work, which contribute significantly.
Jobs in business and construction sectors rose, with modest increases in manufacturing and agriculture. 2014 saw a continued increase in the number of food manufacturing establishments in the MRV, 20 percent more from the previous year.
WAGES BY INDUSTRY
Those sectors with the highest total annual wages in 2014 were leisure and hospitality (about $19.2 million), professional and business services (about $13.2 million) and construction (about $11.3 million).
The industry that shows the most fluctuation in total wages is manufacturing, with wages totaling $3.3 million in 2008, rising to $15.4 million in 2010 and down to $2 million in 2014.
WAGES PER EMPLOYEE
The average employee wage in the MRV ranges from just under $19,000 in the leisure and hospitality sector to nearly $90,000 in information. The information sector shows the greatest increases in average wages of all sectors, growing from about $62,000 in 2008 to about $89,000 in 2014.
Both information and business sectors provide the highest annual wages per employee in 2014.
Health care and social services showed a significant drop in annual wages, at almost 40 percent. There was one fewer establishment reported in that sector than in 2013.
Although the leisure and hospitality sector employs the most people, it shows the most wage stagnation, along with retail and local government.
COMMUTING FOR WORK?
Data between 2002 and 2013 shows a decrease in the percentage of Valley employees who also work in The Valley. Again, the data does not capture self-employment figures. The Economic Vitality Series of 2014 estimated self-employment income in The Valley at 13 percent in 2012, nearly twice that of the state average.
One thousand twenty-two Valley residents worked in The Valley in 2002, declining to 798 residents in 2013. The number of employees who live outside of The Valley has increased by 249 since 2002.
REFLECTIONS
Schwartz said that while statewide data often shows holes, it is useful to look at trends over time. Even data collected from a two-year period can give a good picture of what is happening.
He explained that with the planning district’s 2014 Economic Vitality Series, many business owners and community members believed that Sugarbush Resort and the hospitality sector are leading The Valley’s economy, but the whole picture shows more diversity.
Construction, in terms of the amount of jobs offered, is a “quite steady, hidden part of our economy,” Schwartz said.
And agriculture, although the smallest industry in The Valley with 28 jobs recorded, is “a very important piece of our landscape, heritage and quality of life,” Schwartz said.