2022 marks a significant effort by the Mad River Valley Planning District (MRVPD) to make community data more accessible, usable and integrated into local decision-making processes.
“Questions of community well-being and resilience are more urgent than ever: who are our most vulnerable community members? What are the greatest risks we face? How do we rebuild from the pandemic stronger, more equitably and sustainably?” said MRVPD community planner Amy Tomasso.
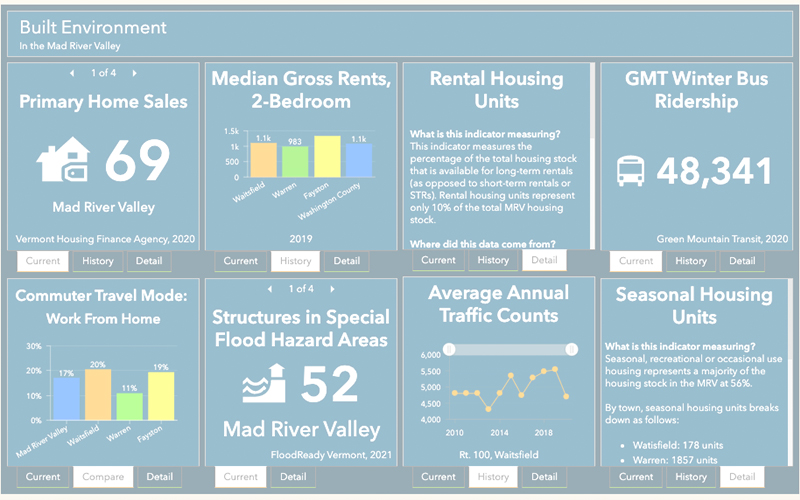
She said that the annual MRV Data Report, produced by MRVPD, helps to answer these questions, but only if the data is understood and used. To address this gap, MRVPD launched the MRV Community Dashboard on March 17, a new online platform for community members and decision-makers to access, visualize and track data that is pertinent to the MRV's well-being and resilience.
What does the dashboard include?
The dashboard looks at five domains which answer the question “How is the MRV doing?” The domains are: built environment, natural systems, community connections, social infrastructure and economic opportunity. Each dashboard domain features eight data indicators which go in-depth to explore issues from health care to water quality to housing data; where available, each indicator also includes historical and narrative context.
“The result is a community resource that strengthens community capital and resilience while being free and accessible to all, from high schoolers, to curious or concerned citizens, to elected representatives. The community dashboard is not 'just another report on the shelf.' It is a living, iterative process through which we can continually monitor our progress (or lack thereof) in order to more effectively communicate, collaborate and act,” she continued.
The dashboard was created by the Mad River Valley Community Dashboard Advisory Committee, which worked with MRVPD staff since fall 2020 to dig through recent Mad River Valley visioning efforts, Town Plan goals and similar community indicator projects to develop a framework for Mad River Valley-specific community indicators, launch the Mad River Valley Wellbeing Survey, review the survey’s results and best communicate all this data back to the community.
The Wellbeing Survey was created to provide a deeper understanding of how The Valley’s people, environment and economy are doing. The survey explores overall life satisfaction and dives deeper into 10 defined domains (such as community vitality, social connectedness and material well-being). Survey questions are based on the Vermont Happiness Study led by the University of Vermont’s Center for Rural Studies, the Vermont State Data Center, and Gross National Happiness USA, which provide a longitudinal point of reference and comparison to MRV-level data. The survey was distributed online and in print during April 2021, and received a total of 416 responses from residents of Warren, Waitsfield and Fayston – about 8% of The Valley’s total population. Survey responses are poised to serve as an important tool for accountability and transparency between elected reps and residents; survey results can improve data-driven decision making to strengthen Valley-wide well-being.
MRVPD hopes the dashboard will be a widely valued and utilized community resource and is committed to evolving the online data and available tools to meet feedback and changing community needs, Tomasso said. Future iterations will also provide context and resources to connect data points to on-the-ground action and support, ensuring that the MRV's needs are being prioritized by defining goals and measuring progress.
Dashboard data will be updated regularly, and MRVPD will be repeating the MRV Wellbeing Survey annually in the spring, with a goal of increasing respondent population diversity. The dashboard can be accessed via mrvpd.org, or directly at https://bit.ly/mrvdashboard.