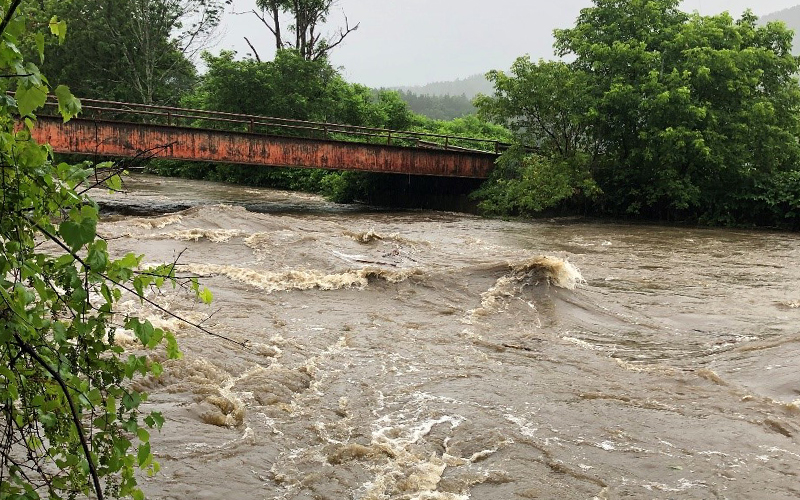
On July 23 and 24, teams of Mad River Watch volunteers visited field sites to collect data and make careful environmental observations for the first time this summer. This article is part of an ongoing series that shares highlights from this field work as well as lessons learned from this year and the past 39 years of Friends of the Mad River’s Mad River Watch program. This summer’s articles will focus on exploring the Mad River in the context of its surrounding watershed.
MONITORING FOR STORM IMPACT
The heavy rains and risk of flooding on July 10 kept most of the Mad River Watch volunteers at home. While some volunteers did visit their field sites to take photos directly following the storm, for most of them this is the first time they have returned to these locations with the intention to collect data since the storm. The Mad River watershed avoided most of the flooding and major erosion issues on roads or streambanks but volunteers still found evidence of the storm. Sediment, stones, and woody debris all shifted as a result of high waters. Some areas, like the beach at Ward Access that is now covered in fine sediment, look dramatically different. “The reconfiguration of the beach at Ward’s is amazing. It looks so different. Amazing what power water has,” noted Mad River Watch volunteer Jenn Grant.
In many areas, new logjams of woody debris have formed. “While these areas may look messy, they actually provide a lot of value to the river – from providing habitat for fish to moderating the flow of sediment downstream,” said Friends of the Mad River director Ira Shadis. Many of the other observations recorded by volunteers, including pH, conductivity, and water temperature, were in normal ranges – a reflection of how well the Mad River handled the storm. “We might have expected to see increased conductivity or lots of turbidity if there was more active erosion during the storm.”
RIVERS AND FLOOD PLAINS
The volunteers that did go out directly after the storm were able to photograph just how close the Mad River was to flooding. “In addition to the height of the water, the videos volunteers sent in really showcased the incredible power of the water,” said Shadis. “At its peak, the Moretown Gage recorded a discharge of over 7,000 cubic feet per second (cfs). While that number is striking, it’s the change from just above 100 cfs to above 7,000 cfs in 12 hours that really stands out.”
Most of the rivers in Vermont, including the Mad and many of its tributaries, have been straightened, channelized, and disconnected from their flood plains. “A few hundred years ago, the Mad River watershed would have been full of beaver-managed wetlands and mountains of woody debris,” Shadis said. “The river itself would have been a complex of side channels and braiding streams. Today, the river is not able to access much of its historic flood plains and the water becomes constrained as a result. Imagine the difference in power between water from a hose and the water seeping out of a wet sponge.”
NOTES FROM THE FIELD
There were seasonable air temperatures on Sunday morning, averaging 66.5F, and Monday, averaging 67.4F. Water temperatures were lower than this time last year, likely reflecting the continued influence of runoff from the storm and subsequent rain showers. The lowest water temperature, 59F, was recorded in Shepard Brook on Sunday morning. The highest temperature, 68F, was recorded on the main stem near Meadow Road on Monday. Five sites recorded a high flow, eight a moderate flow, and two sites had a low flow. pH across all siteS averaged 6.7. Volunteers noted the presence of avian wildlife, including kingfisher, chickadees, blue jays, song sparrows, geese, and pigeons.
You might also like


