With July’s extreme rainfall and flooding, many people in The Valley and Vermont are thinking back to Tropical Storm Irene in 2011 – and shuddering. Irene was, many hoped, a once-in-a-lifetime occurrence. Yet as heavy rain approached Vermont once more, Governor Phil Scott declared a state of emergency on July 9, 2023, with catastrophic flooding following in subsequent days. The Mad River Valley came through last month’s rain with far less damage than surrounding towns saw, and fared far better than The Valley had during Irene. But what happened last month was, if not entirely unprecedented in the Mad River Valley, still shocking. Data from sensors across The Valley suggest this weather event was uniquely severe, even if towns along the Mad River escaped the worst of the damage.

To understand what happened in July 2023, it is necessary to consider the data in a historical context. Below is a graph showing how last month’s precipitation compares to previous years. The 2023 daily precipitation totals, in yellow, frequently exceed the daily mean for the same date, shown in blue. The 2023 daily precipitation totals (measured on the Mad River near Moretown) exceeded the daily precipitation records (measured in Waitsfield) on two days: July 10 (3.82 inches in 2023; record 1.39 inches) and July 16 (1.29 inches in 2023; record 0.87 inches). The mean total precipitation for July in Waitsfield is 4.93 inches; the USGS gage at Moretown showed nearly twice as much rainfall – a total of 9.7 inches – for July 2023.
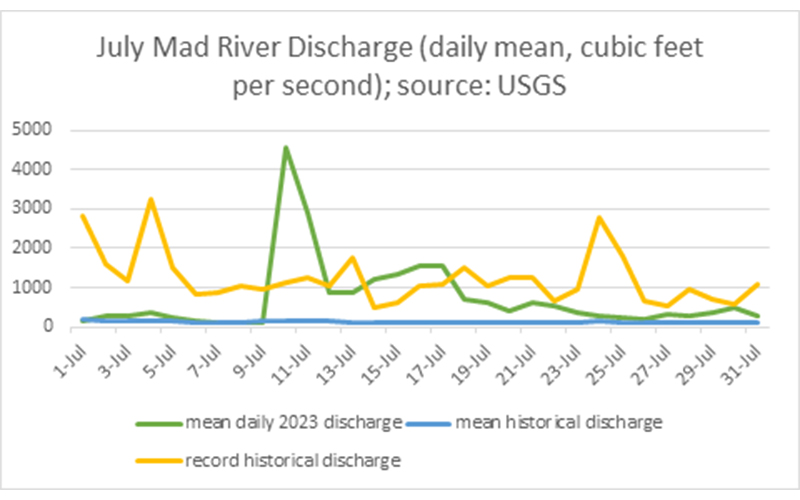
Similarly, the Mad River’s flow was far higher throughout July 2023. River discharge is the volume of water flowing through a specific location during a specific period of time; here, it is measured in cubic feet per second. The discharge at Moretown was higher than the daily average for much of July. On several days in July, the Mad River’s mean discharge over the course of a single day exceeded previous records: July 10, 4,580 versus previous record 1,120 cubic feet per second; July 11, 2,890 versus 1,270; July 14, 1,200 versus 478; July 15, 1,340 versus 637; July 16, 1,560 versus 1,040; and July 17, 1,570 versus 1,090 cubic feet per second.
The graph below illustrates, in green, mean water discharge volume, in cubic feet per second, during July 2023. Mean daily historical discharge is the blue line that runs along the bottom; the yellow line reflects daily historical mean discharge records. This data was measured at the USGS gage on the Mad River in Moretown. The July 2023 mean daily discharge exceeded previous records for this location during two time periods last month: July 10-11 and July 14-17 – a total of six days.
Is this to be expected going forward? Will Vermont and The Valley just keep breaking daily records? According to the Vermont Climate Assessment, climate change is driving significant shifts in both weather and waterways in Vermont. Specifically, Vermont is seeing higher overall temperatures and precipitation, and heavy precipitation events will continue to cause flooding and runoff-driven water pollution. The changes being seen now in the short term reflect longer-term increases in precipitation. Per the Assessment, the amount of precipitation Vermont receives in a year has gone up by 7.5 inches since the early 1900s. It’s a trend that’s expected to continue (along with periods of another climate extreme – drought).
Note that the numbers presented in this article do not constitute a perfect comparison, because the data came from a couple of different sources and was collected at a couple of different locations. The USGS data has been collected for 94 years; the NOAA data only date back to 1985, meaning that this dataset is likely more heavily influenced by the increasing feedbacks of climate change in recent decades. The annual mean precipitation data was collected at NOAA’s Waitsfield location, as were the precipitation records. The 2023 precipitation amounts were the USGS gage on the Mad River in Moretown. The two locations are close enough together, and receive sufficiently similar weather, to allow a reasonable if not perfect comparison between data collected at the two sites. All river discharge data also came from the USGS gage at Moretown. The USGS data is provisional, meaning that the data has not yet undergone the survey’s review and approval process.
To check out USGS data in real time visit: https://waterdata.usgs.gov/monitoring-location/04288000/#parameterCode=00065&period=P7D For best results, click “legacy real time page” near the top of the website.