This Economic Vitality Dashboard provides information from the month of March and 2016 year-to-date (YTD) totals where possible with comparisons with the same period (month) and YTD for 2015. Organizers have rearranged some of the data points, creating better groupings based on the type of information. They added arrows this month for a quick glance at what is “up” or “down” compared to the same period last year and 2016 YTD compared to 2015 YTD.
The Ski Report heads the table now and focuses on skier visits and snowfall for the month and for the season-to-date. This season’s low snow volume continued in March. Skier visits for March were down by a third again, compared with February (75,325). The season-to-date number of 305,963 skier visits is starred (*) because organizers added into it a correction from Mad River Glen. The blank cells, “Prior Year Period” and “Prior YTD,” mean data for previous years for these data points is not available.
The Local Update section includes purely local information as opposed to including the receipts information.
Lodging Occupancy was down only 1 percent compared to last year’s March and only 2 percent compared to last month. The first arrows appear here. Web visits are starred (*) because this data point has been corrected to reflect year-to-date without Mad River Glen data. Building Permits Issued in March were up compared to last year’s numbers. The data point is starred (*) because it includes Fayston and Waitsfield only, not Warren this month. Real Estate Sales (February data) are down in both time comparisons. The Unemployment Rate (February data) is down for both time comparisons.
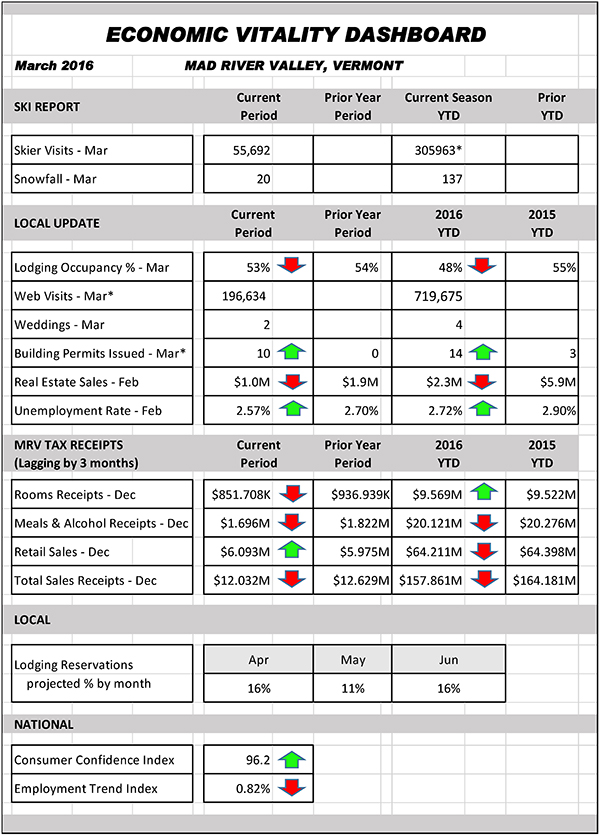
The Mad River Valley tax receipts section includes data points gathered from the Vermont Departments of Taxes and Labor. Those items will always be three months behind. December’s numbers are the latest available. Rooms receipts were up YTD compared to last year and December’s retail sales were up compared to December 2015.
The local section that includes lodging reservations projections shows what the 11 reporting properties are seeing for this and the next two months.
The national section shows two indices that are pulled from the Conference Board’s websites.
“The Dashboard Team is continuing to explore data collection options and examples from other regions and economic development organizations. We are looking at other town and regional dashboards and talking with folks who have been at this longer than we have. When the community settles on its goals for economic and community development, we will figure out how to measure those goals and create the baseline data. We’ll track those monthly, quarterly or annually, depending on what makes the most sense and data availability. We welcome your feedback on the information that appears here; please contact us at