On August 7 and 8, teams of Mad River Watch volunteers visited field sites to collect data and make careful environmental observations for the fifth time this summer. This article is part of an ongoing series that shares highlights from this field work as well as lessons learned from this year and the past 38 years of Friends of the Mad River’s (FMR) Mad River Watch program.
MONITORING pH
pH is a measure of the acidity of a solution. The pH scale ranges from 0 to 14 with lower values indicating more acidic conditions and higher values more alkaline. “We measure pH in the Mad River Watch program because most wildlife species cannot survive in water that is too acidic or too basic,” said FMR director Corrie Miller. The optimal pH for most aquatic species is between 7.0 and 9.0.
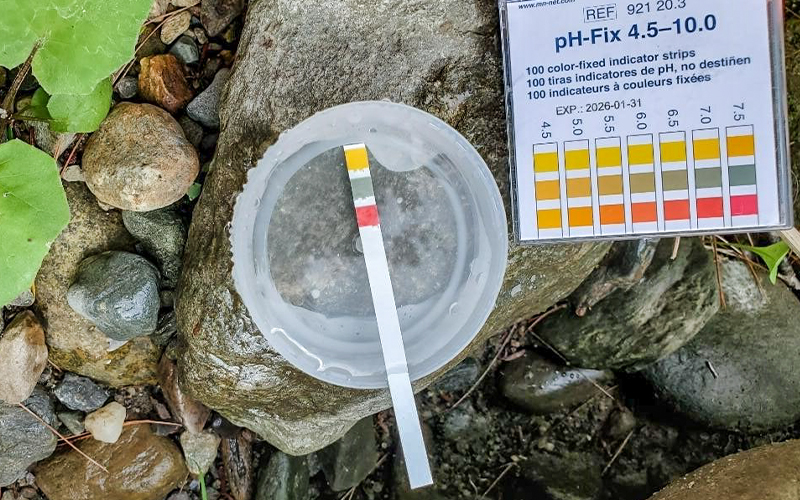
Since 1988, Mad River Watch volunteers have measured pH at field sites across The Valley with handheld pH meters in the most recent past. This year, however, volunteers are using test strips. “The test strips are a simpler way to get a broad picture of pH across the watershed,” said FMR stewardship manager Ira Shadis. “But, if something really alters the pH, these strips are still sensitive enough to pick it up. This lets our volunteers spend more time observing the natural world and less time fiddling with equipment.”
pH OVER TIME
The pH of the Mad River is naturally influenced by the bedrock and soils through which it flows but can also be affected by human inputs in the form of runoff and pollution. Changes in pH caused by pollution have an impact on the chemistry of the water. “Historically, in Vermont, we’ve seen pollution lead to acidification of freshwater systems,” said Miller. “This changes the way aquatic organisms, like trout, can absorb and use nutrients like nitrogen and phosphorus and metals like lead, copper, and iron. A significant and widely impactful cause of freshwater acidification in Vermont was acid rain caused by coal-burning power plants and factories, with the highest emissions in the 1970s.”
The Clean Air Act of 1990 promoted the use of cleaner burning fuels and technologies to ‘scrub’ sulfur dioxide emissions from power plants prior to release to the atmosphere -- reducing the acidification effect. “While Vermont doesn't have any coal-fired power plants, our weather can come from the west and plants in the Ohio River Valley sent pollution this way,” said Miller. “The positive impacts of the Clean Air Act were observed by Mad River Watch volunteers in the Mad River Valley. pH from all locations along the Mad increased (became more alkaline and less acidic) after the new legislation went into effect.” The Mad River Watch volunteer monitoring effort was able to document local changes that mirrored those in other northeastern areas resulting from national legislation.
Mad River Watch volunteers have collected pH measurements using test strips at each of the field sites on five or more occasions this summer. The average of all these pH measurements is 6.97. Historical Mad River Watch data, including pH, can be explored at friendsofthemadriver.org/historicaldata.
HIGHLIGHTS FROM THE FIELD
Very high temperatures marked both field days, with air temperatures across the watershed averaging 80F on Sunday and 75F on Monday. Water temperatures were similarly high. The lowest water temperature recorded was 65F at Freeman Brook on Sunday at 9:40 a.m. The highest water temperature recorded was 77F at 9:45 a.m. on the mainstem of the Mad River near Meadow Road on Monday. The average pH on both days was 7. Volunteers noted low water levels across the watershed, with only two of the sites recorded as having moderate flows. In general, volunteers noted little human impact or trash present at their sites. The volunteer at the Ward’s Access Area in Moretown noted that the site was, “amazingly clean here today; nothing except a forgotten T-shirt!”


