On August 6 and 7, teams of Mad River Watch volunteers visited field sites to collect data and make environmental observations for the first time this summer. This article is part of an ongoing series that shares highlights from this field work as well as lessons learned from this year and the past 39 years of Friends of the Mad River’s (FMRF) Mad River Watch program. This summer’s articles will focus on exploring the Mad River in the context of its surrounding watershed.
SWIMMING IN THE MAD RIVER
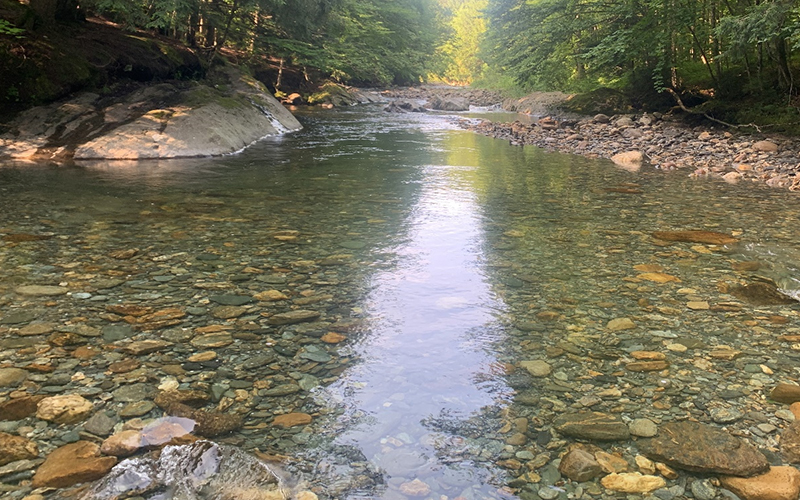
Water quality issues following the July storm have left many Vermonters scrambling to find safe places to swim. With relatively little flooding or significant erosion, the Mad River returned to lower levels and clear water relatively quickly. “Since about mid-July people have been reaching out asking if the Mad River is safe to swim in,” said Friends of the Mad River director Ira Shadis. “Right after the storm my advice was for folks to give it time. High flows and murky water pose a risk in themselves. And we know runoff from the landscape can lead to increased pollutants and the risk of harmful bacteria in the water. In general, a good rule is to wait 24 to 48 hours after it rains to go swimming. With bigger storms it can be a good idea to wait a little longer,” he said.
TESTING FOR SWIMMING SAFETY
Since 2021, Friends of the Mad River has been rebuilding its Mad River Watch program. These changes have included the addition of new data, like conductivity, as well as a pause on the collection of other data, like E. coli counts. “Over the years of collecting E. coli data, we’ve essentially answered the questions we set out to answer,” said Shadis. “We know that E. coli counts tend to increase as you head downstream from Warren towards Moretown. We know that the vast majority of the time these counts don’t reach the level of a health concern except for after it rains. And we recognize that E. coli, fecal coliforms, turbidity, and other pollutants are coming from what are called non-point sources – essentially washing off the surrounding land during storms,” he added.
While FMR does not currently collect E. coli counts, the organization plans to do so in the future. “We want the data we collect to be useful to this community,” Shadis said. “When we collect a water sample, send it to the lab, and get the E. coli counts a few days later, the conditions in the river may have changed significantly by the time we have anything to report. Other than the advice about waiting to swim after it rains, we don’t have a reasonable way to say something about E. coli in real-time. Most of the data we collect allows us to see longer term trends. But there is value in learning about the trends. We can observe changes in the baseline flow levels of E. coli, fecal coliforms, turbidity, and other pollutants. We can see how they relate to one another, to storm conditions, and spatially along the length of the river and its tributaries – and how these relationships change with time,” he pointed out.
NOTES FROM THE FIELD
Water temperatures remained cool when compared to this time last year. Temperatures ranged from a high of 63F at the Ward Access site to a low of 58F at Riverside Park. The mean water temperature across all sites 59.9F. For comparison, the mean water temperature on August 7 and 8 last year was 78.8F. Higher flows and consistent rain have likely kept water temperatures down. Of the 17 sites visited on Sunday and Monday, 12 had a moderate or high flow level. “Very quiet morning here,” noted the volunteer at the Ward Access site. “A few nearby chickadees calling and far off blue jays. But not the usual chatter at this site. Perhaps they’re tired out after such a beautiful weekend.”


